Product Inception is the first step towards Product Delivery. A lot of our product’s future hinges on how effective our inception was and one of the most pivotal outcome of inception is getting the prioritised scope out to kick-start delivery.
As Ron once commented “She needs to sort out her priorities” when Hermione said “ Now, if you two don’t mind, I’m going to bed before either of you come up with another clever idea to get us killed. Or worse, expelled” , every Product manager & Product owner felt targeted. It is extremely essential for a Product person to know what all needs to prioritised and How. Answering the how could be essentially overwhelming because of so many prioritisation techniques and frameworks to choose from; that it leaves one bewildered with which one would be the right fit for their use case.
Don’t be stressed if you are also figuring out which prioritisation technique to go forward with. I’d say let’s create one instead. Yes, you read it right. You might be wondering if we are so puzzled to select from existing ones, how possibly creating one from scratch be any easier. Kindly hear (rather read) me out for a little more while, and you’ll know why I am claiming so.
Let’s divide the entire Backlog Prioritisation Process into small milestones and see how we fit in creation of a prioritisation technique in it:
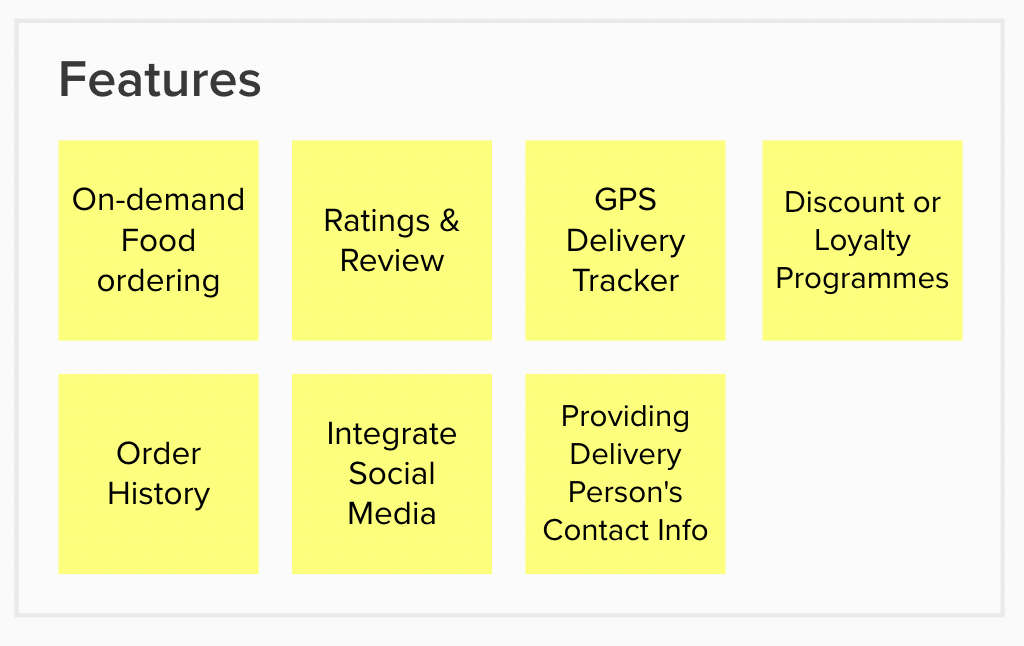
Milestone 1 : Create a list of features that you would want to prioritise Let us assume, we are Product Managers/ Product Owners of a food delivery app. We are done with our product inception and following is the list of features that we want in our mobile application:
Milestone 2 : Identify product priorities
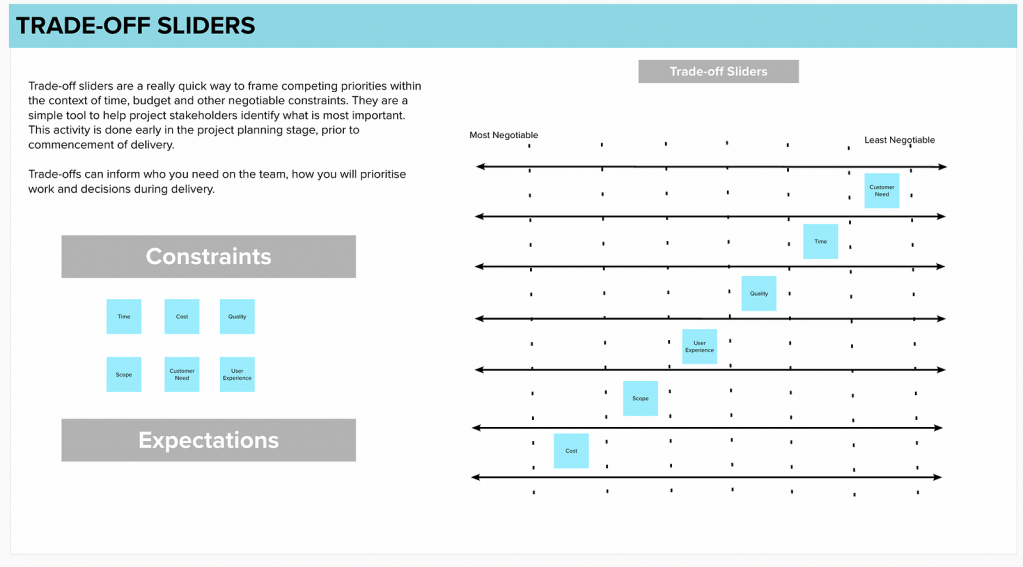
What is it? Trade-off sliders help to visually prioritise project or product dimensions.
Why do it? When everything is equal, it’s hard to focus your attention. When you’re developing a product, you need to understand and prioritise the most important dimensions and then focus your time accordingly.
How to do it? Start off by identifying the project or product constraints you are working with. The bare minimum project constraints involve — Cost, Time and Scope and the top it up with your project specific constraints that could be Usability, Quality, Performance etc. Next part of the activity is to get all the stakeholders in a common space and ask them to relatively position these constraints on a scale to see what all is non-negotiable and what all can be negotiated.
For the above food delivery app project, let say we identified certain constraints (Time, Cost, Scope, Quality, Customer Need, User Experience) and performed an activity with the stakeholders to get our trade-off slider in place which resulted in Customer Need, Time and Quality being least negotiable in the mentioned order.
Milestone 3 : Convert product priorities to quantifiable success metrics
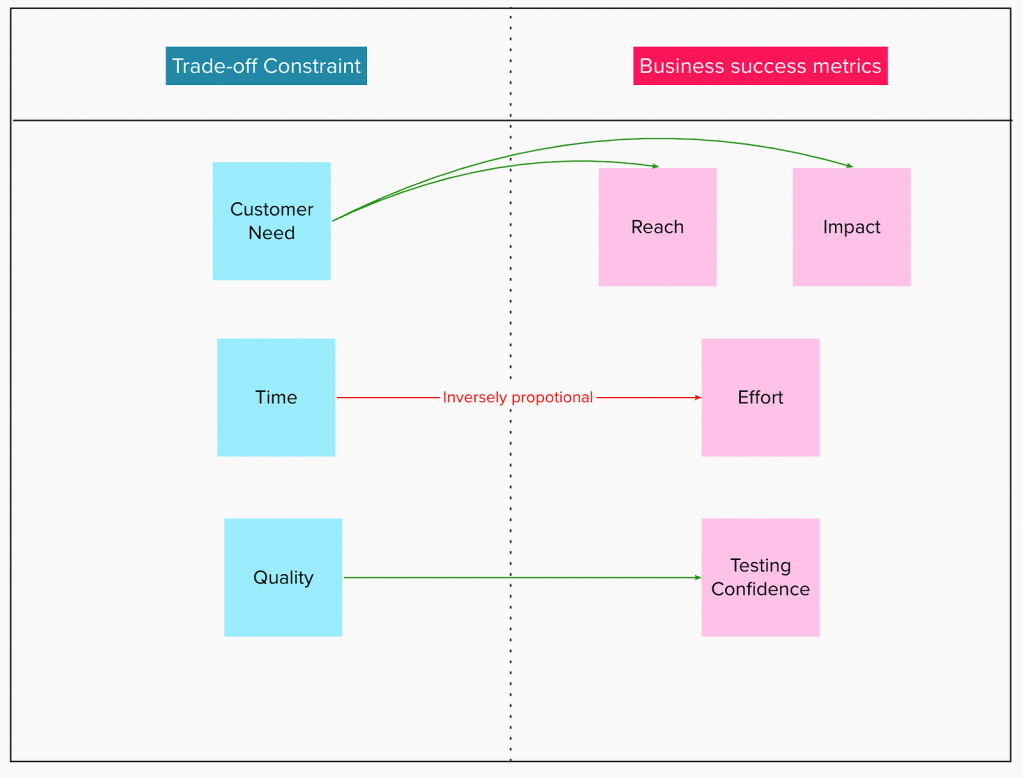
Now, it’s time to choose your top 3 to 5 non-negotiable constraints and correspond them to a measurable business outcome or success metric. Like mentioned above, in our case study the top 3 non-negotiables are Customer Need, Time and Quality. Let’s define success metrics for each one of them
Customer Need — It refers to the demand a feature would have from a customer’s perspective. It would relate to how many people want to use the feature and the value it will create from them, hence Reach & Impact are two metrics that we should use for prioritisation. Since, Reach & Impact positively influence the customer need, they should be refered to as ‘Positive contributors’
Time — Time is a non-negotiable because the stakeholders want to deliver to the customers as quickly as possible. A business metric that we can use here is Effort because if Effort is high then Time to market would be less and vice-versa. Thus, Effort has an inverse relation with Time and should be considered as a ‘Negative contributor’.
Quality — Quality of a product can be measured if we get minimum customer feedbacks and bugs on production. At the start of a project this metric can’t be used due to lack of projected data, so another measure could be Testing confidence which can be measure on the basis of internal dependencies, impact areas and domain complexity of a feature. Testing confidence would again be a ‘Positive contributor’ because more the confidence greater would be the projected feature quality.
Milestone 4 : Identify/Attach priority weights to each success metrics for the product
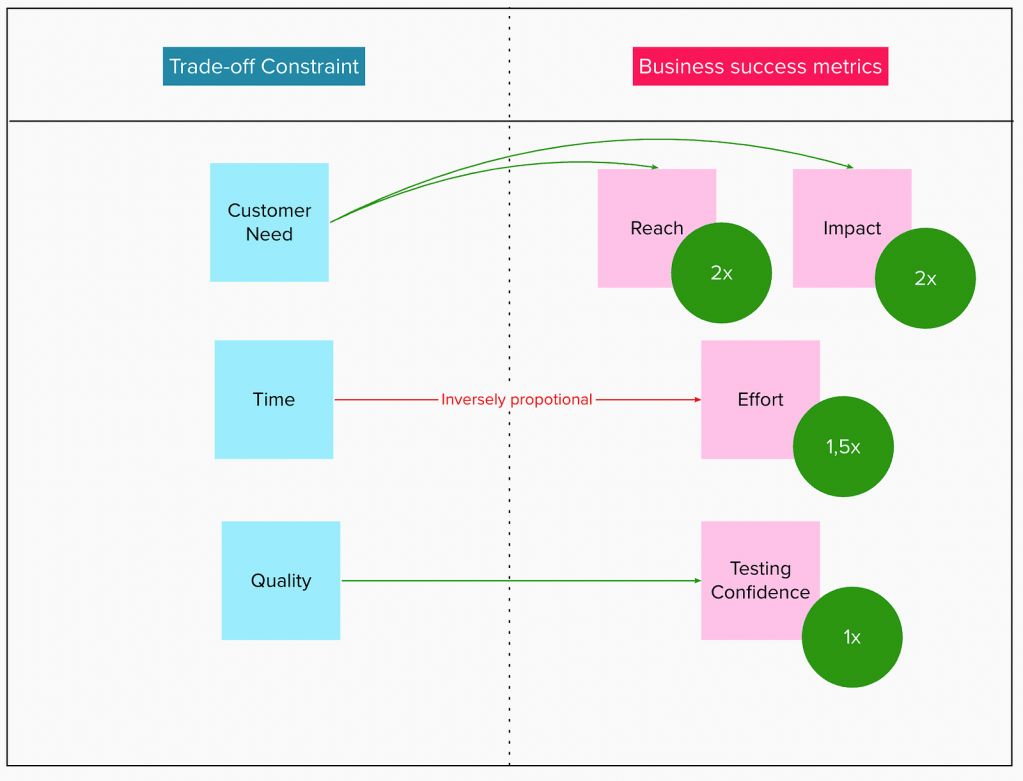
For attaching weights, we can use the relative priority set on the trade-off slider as well and then weigh the relative percentage importance of each of the selected trade-off constraints
In accordance to the trade-off slider for our case study, if we assign base weight of 1 to Quality, then relatively Time is about 50% more crucial, so Time gets a weight of 1.5. Further extending to Customer need, which is almost twice as important as Quality, would be bestowed a weight of 2. Assigning weights could be very subjective, so be conscious when you do that. One can preferably use estimation scales like fibonacci to take a stab on weights as well. This might require some trial and error as well, before you figure out the right weights.
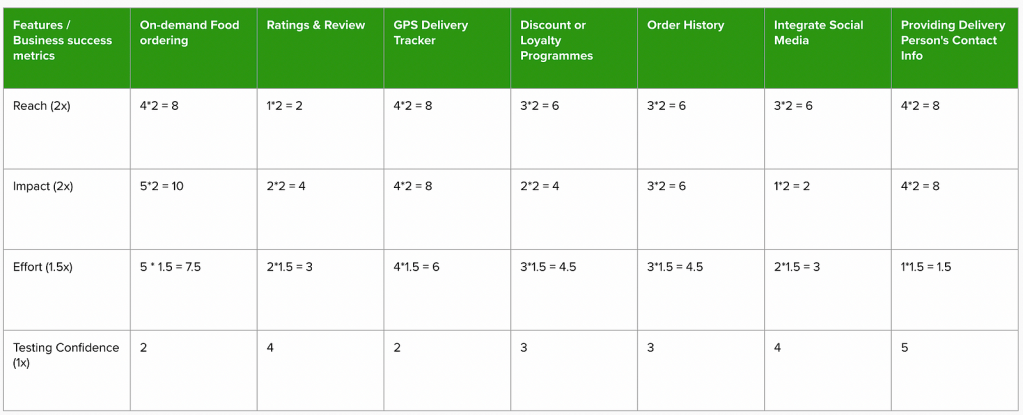
Milestone 5 : Quantify relative size for each success metric for each of the feature
If you are a fan of numbers, you are about to see A LOT of numbers on the screen. If not, we can’t do much about it. Let’s deal with it 😛
Now is the time to create a matrix for each feature cross each business success metric and start assigning numbers to the combination. Make sure to include product, tech, testing and design representatives for this exercise. Start assigning points to each combination (feature x business success metric) on a scale of 1–5 and then multiple by the above assigned weight to get the final number
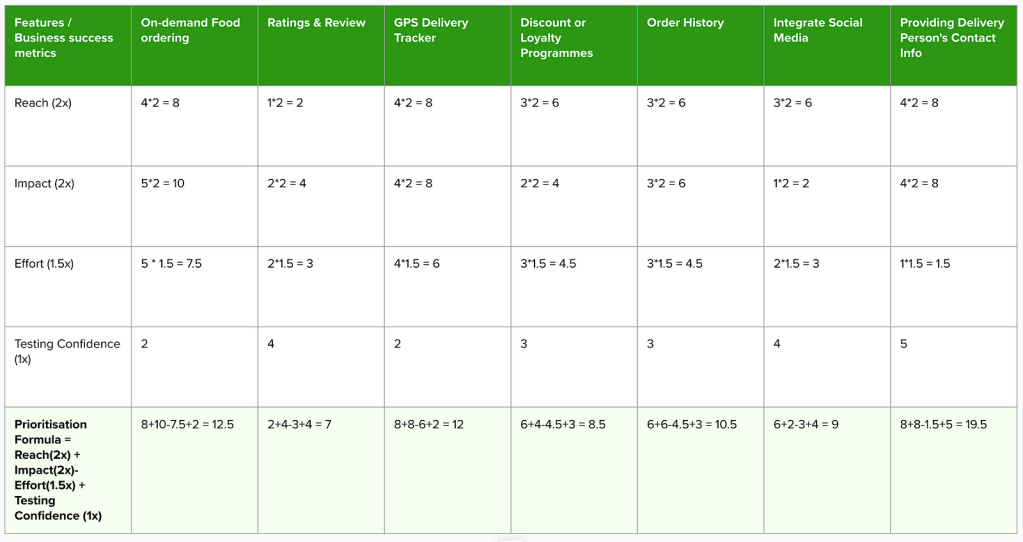
Milestone 6: Compute prioritisation strength for each feature based on weights and relative size of business metrics
Let us assume your top business success criteria are B1, B2 and B3 and you have assigned weight w1, w2 and w3 to each one of them. Out of these B1 and B2 are positive contributors and B3 is a negative contributor, which simply means that if B1 & B2 are high, the feature would be of higher priority and if B3 is low, then the feature would be higher priority. With this understanding we can generate a prioritisation formula by adding positive contributors and subtracting negative contributors.
Prioritisation Formula = (B1*w1) + (B2*w2) — (B3*w3)
Milestone 7: Rank features by prioritisation strength in descending order
Use the above prioritisation formula to generate an output number for each of your features.
For the food app case study, we would use the following formula : Prioritisation Formula = Reach(2x) + Impact(2x)- Effort(1.5x) + Testing Confidence (1x)
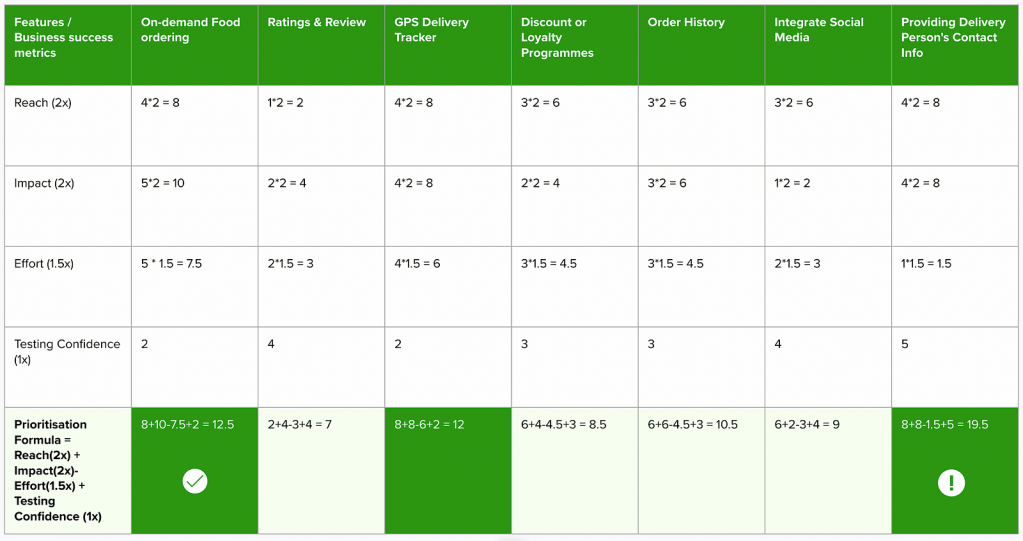
Milestone 8: Tada ! Sort out your feature priorities 🙂
Finally, we have the numbers out and we can simply sort them and see what our order of priorities are !
But there’s a twist in the tale, we didn’t really handle the dependencies and sequencing in the features. Up until this point we have handled each feature in isolation but to accommodate priorities in release plan we need to think of features in conjunction. So, let us Feature A has a higher result number according to the formula than Feature B but can’t be done without Feature B, then we need to count in this dependency while planning.
In the above screenshot, though ‘ Providing Delivery Person’s Contact Info’ has the highest output number but it can’t be done with ‘On-demand Food ordering’ feature, which means our first priority becomes ‘On-demand Food ordering’, followed by ‘Delivery person’s contact info’ and further followed by ‘GPS Delivery Tracker’ so on and so forth.
This might look exhaustive at the first glance but trust me once we get the hang of it, it’s super easy to have the right set of features out in the market that delivers the desired value to the users. Hope you found this useful and you are thrilled to use it in your projects.